
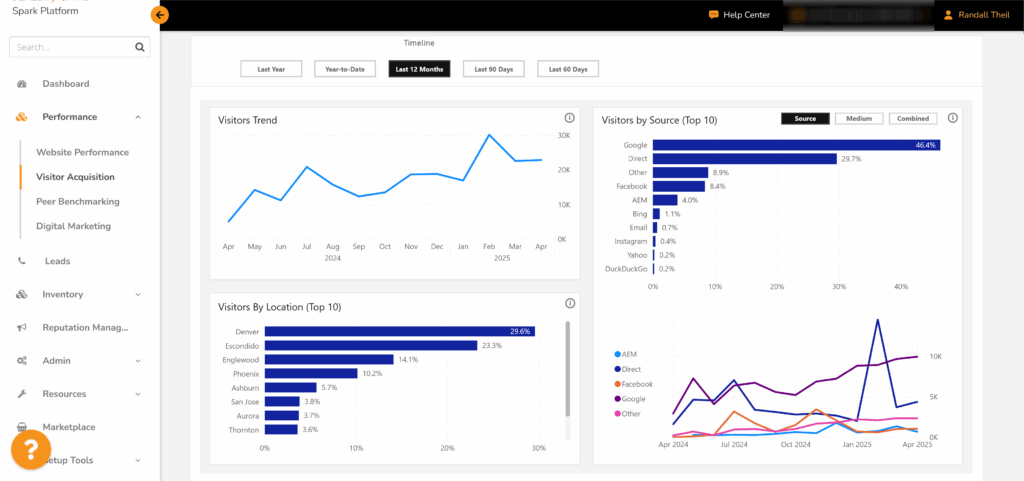
If you want to know whether your marketing efforts are reaching shoppers in the right areas, you need to know where your website traffic is coming from and how they’re finding you. That’s why we developed the Visitor Acquisition Dashboard — a new report built right into your dealership’s Content Management System (CMS) under the Performance tab. This dashboard captures your website traffic trends to help you make smarter advertising decisions and focus your marketing budget where it’s needed most. And the best part? You can access it at any time, completely free.
Why the Visitor Acquisition Dashboard Matters
Running a dealership today means juggling numerous moving parts. Your website is one of the most important parts of that puzzle, serving as the digital storefront that connects you with customers who might never set foot on your lot.
But here’s the thing. Knowing how many people visited your website last month isn’t enough. You deserve deeper insights that answer the “why” and “how.”
- Why did traffic spike last quarter? Was it a seasonal change, a successful campaign, or something else?
- How are customers finding your site? Are your paid ads pulling their weight, or is your SEO doing all the heavy lifting?
- Who are your customers? Which area do most of your visitors live in, and how does that match up with your ad targeting?
The Visitor Acquisition Dashboard provides a clear view of your website’s performance, helping you pave a better path forward.
What You’ll Find in the Dashboard
This isn’t just another analytics report. We’ve designed it specifically to break down key metrics in a way that’s straightforward, practical, and most importantly, useful for your dealership.
Here’s what you’ll be able to track:
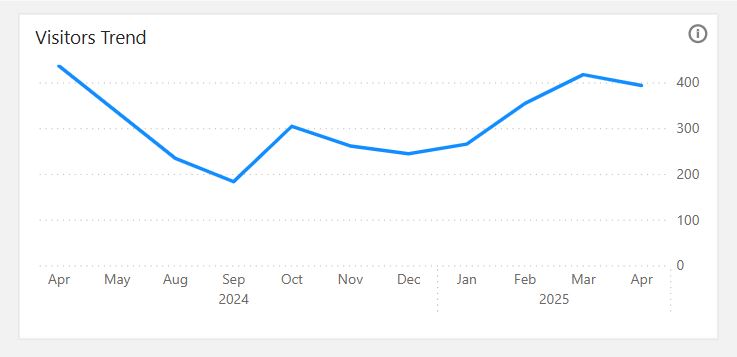
- Visitors Trend: View traffic data at a glance, including increases and decreases over a selected time period (such as the last month, last 90 days, or year-to-date). By understanding seasonal patterns, you can plan effectively, ensuring your inventory levels and marketing campaigns align with your customers’ behavior.
- For Example: Do you notice a dip in January traffic? That might be the perfect time to shift focus to service promotions. Seeing steady growth in spring? Time to increase ad spend for high-demand
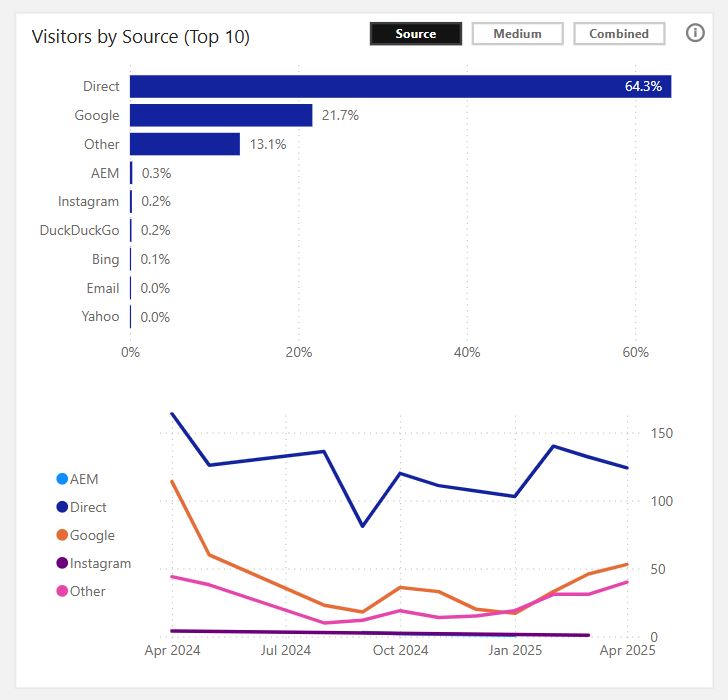
- Visitors by Source (or Medium): Find out which channels and platforms are pulling in the most traffic and which ones could use some attention. Whether it’s organic search, email campaigns, social media, paid ads, or something else, the dashboard highlights what’s working and what’s falling fla
- This data isn’t just about understanding your site visitors; it’s about knowing where to put your next marketing dollar.
- For Example: If the referral traffic for your social media is low but you know the competitor down the street is running a lot of paid social ads, you know where to focus more budget or strategy sessions.
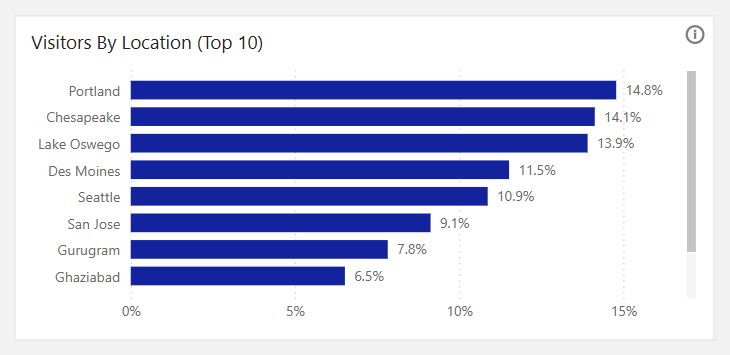
- Visitors by Location: Sometimes it’s about knowing who your customers are, but also where they are. Seeing where visitors are geographically concentrated can uncover critical insights.
- If most visitors come from outside your immediate area, is there an opportunity to target those regions with geo-specific ads?
- If your paid ads are targeting specific ZIP codes, but most visitors are concentrated elsewhere, it’s time for a rethink.
- Real Results: Imagine you’ve been pouring money into ads targeting coastal communities, only to find most of your traffic is coming from inland suburban neighborhoods. Now you can realign your efforts where they’ll have the biggest impact.
How This Helps Your Dealership
The possibilities for growth are endless when you have reliable data at your fingertips to:
- Make Data-Driven Decisions: Instead of guessing where your customers come from, you have the data laid out in front of you.
- Refine Your Strategies: Shift resources to high-performing channels while addressing underperforming ones with fresh ideas.
- Connect with Your Account Representative: Do you have questions about leveraging specific channels or improving weak spots? Bring your insights to your Dealer Spike Account Representative to have a strategic conversation.
The bottom line? You’ll gain clarity on your website traffic, allowing you to make smarter decisions that translate to real-world wins.
What to Do Next
The Visitor Acquisition Dashboard is now available under the Performance Tab in your CMS. It’s time to put it to work for your dealership!
Need a quick tutorial? Take a few minutes to read our Help Center guide.
More Value-Add for Your Website Data
Dealer Spike delivers real data that you can turn into real results beyond the dashboard. Want to see the future of dealership solutions? Visit our Innovation page for a look at what’s new and what’s coming soon.